Prometheus exporter
The application has built in Prometheus exporter, which exposes a set of Golang metrics as well as some application related metrics. The exporter is listening for port 9350 by default and exposes metrics under /metrics subpath, both options could be changed via the command line arguments.
Custom metrics
| Metric name | Description | Metric type |
|---|---|---|
| s3sync_data_total_size | Total size of the synced objects | Gauge |
| s3sync_data_objects_count | Total number of the synced objects | Gauge |
| s3sync_errors_count | Number of errors, could be used for alerting | Counter |
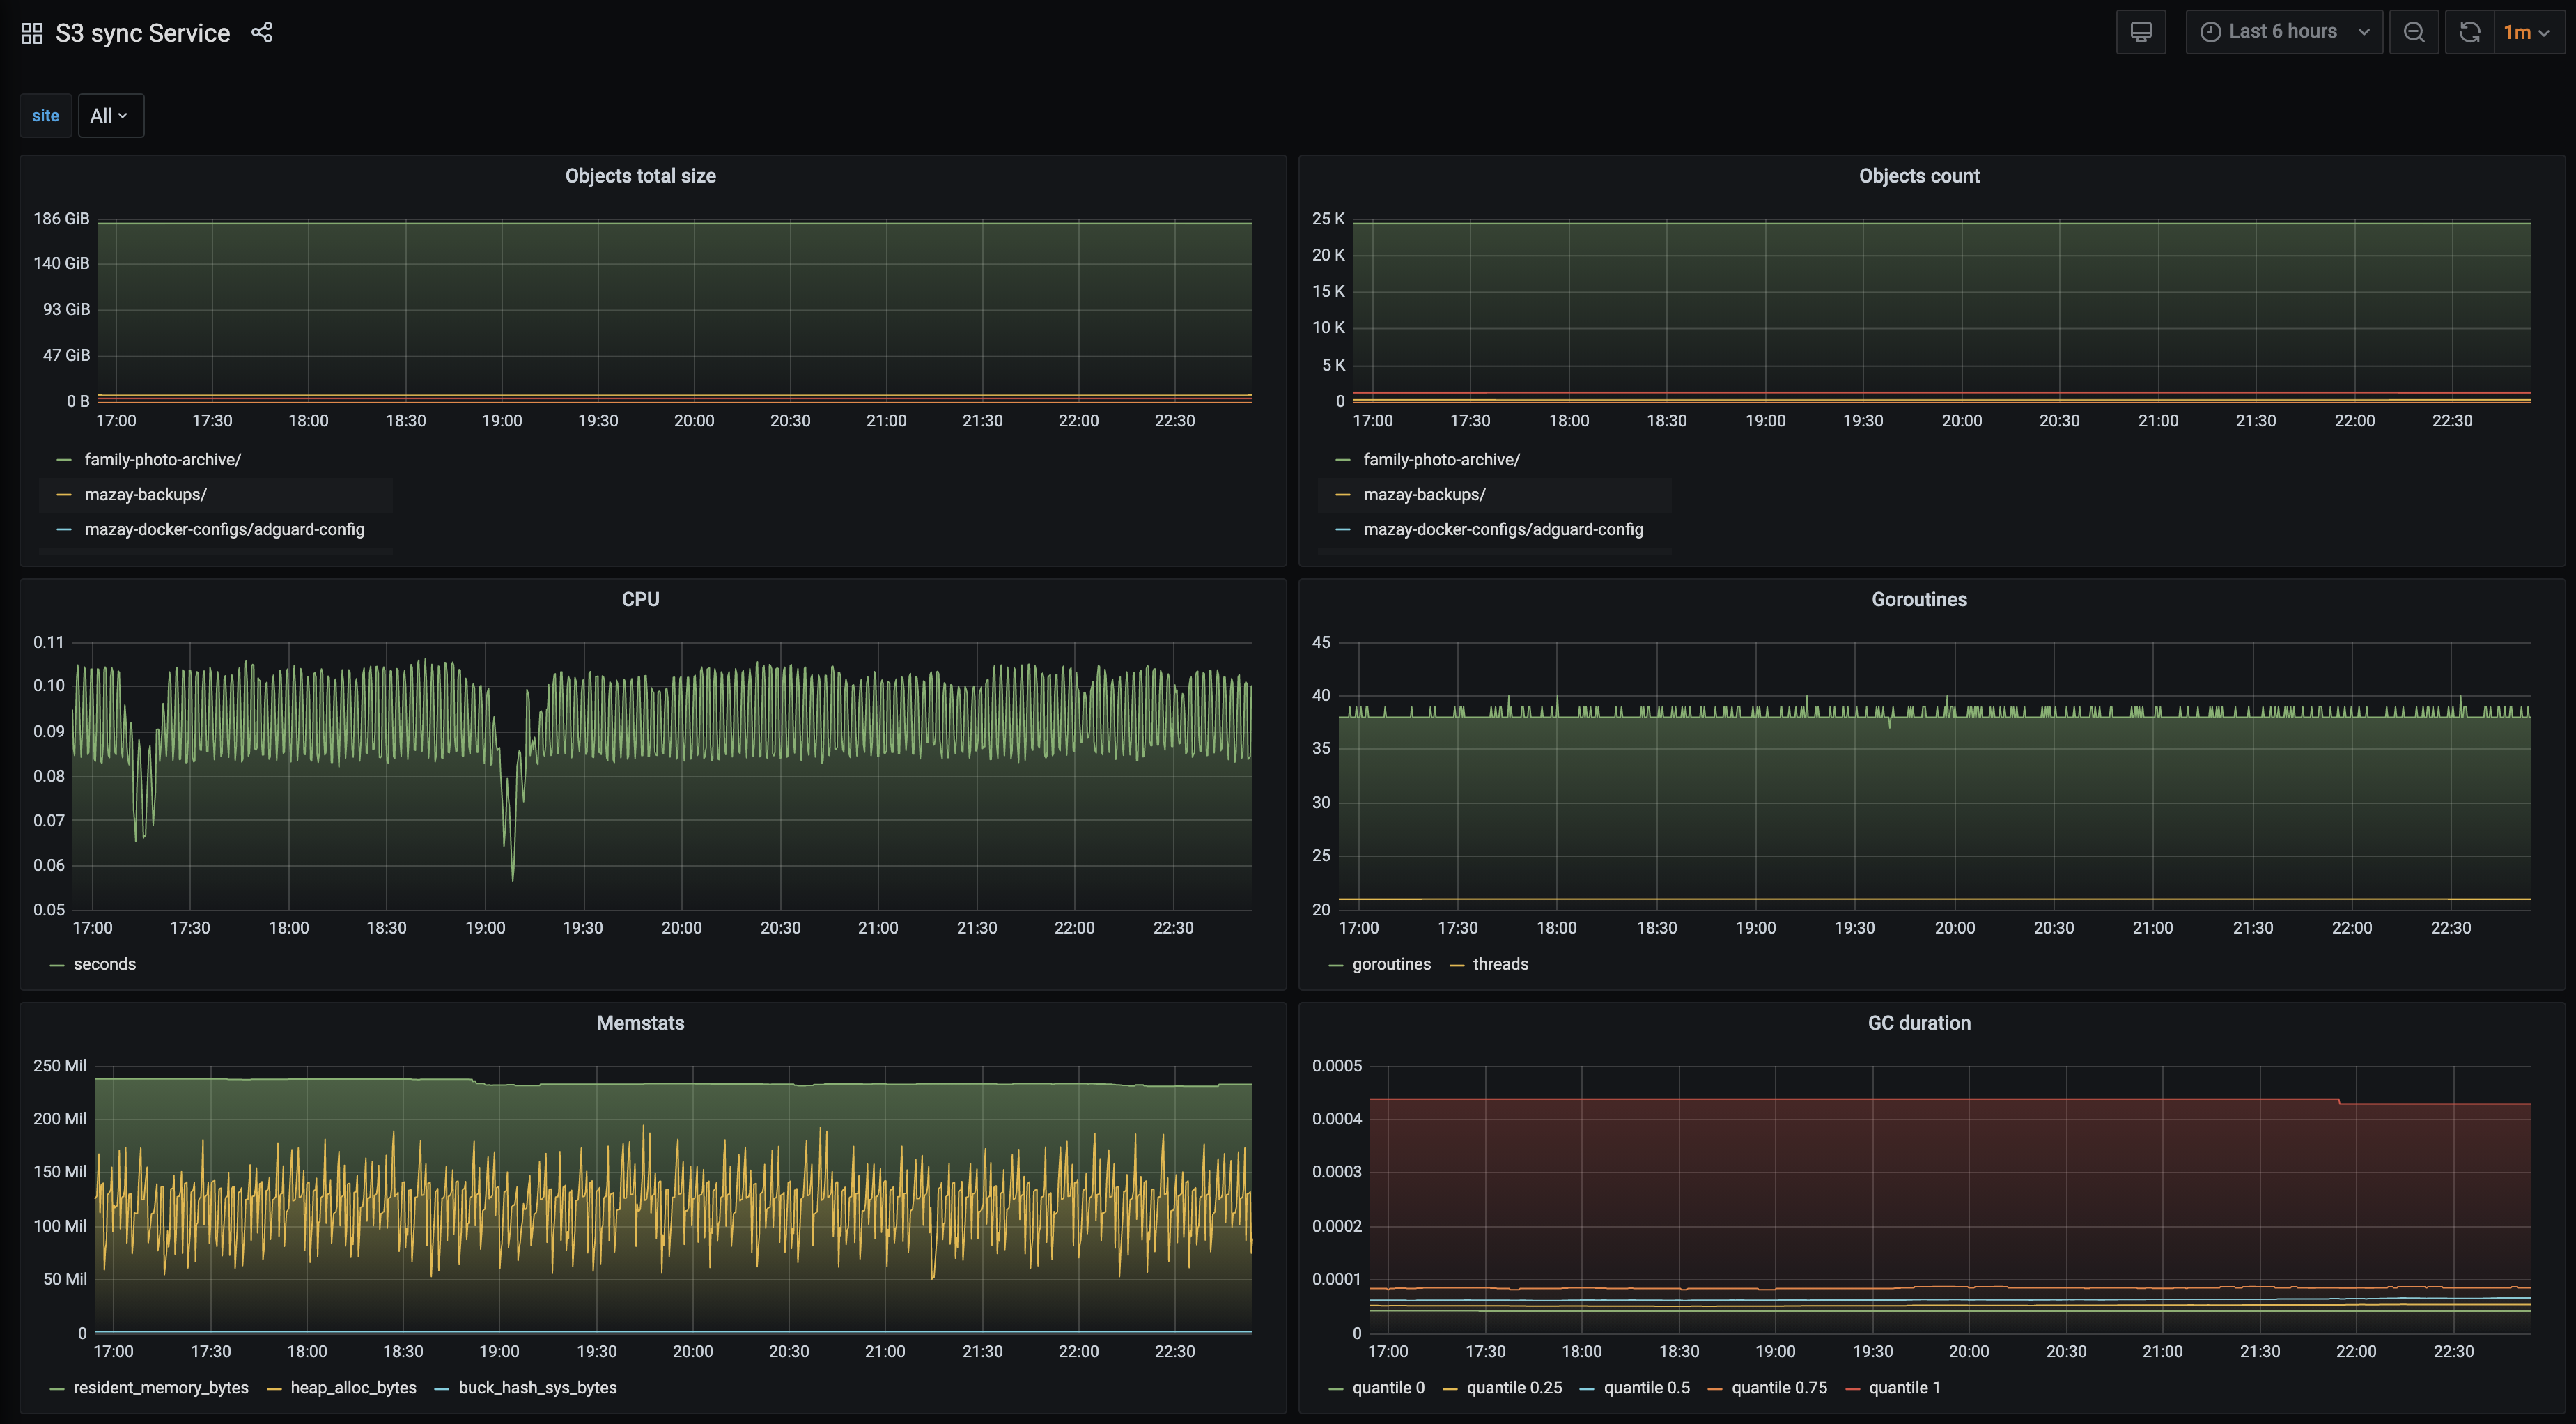
Grafana dashboard
The exposed metrics can be used to create alerts and/or Grafana dashboards similar to the following, the source is available here.